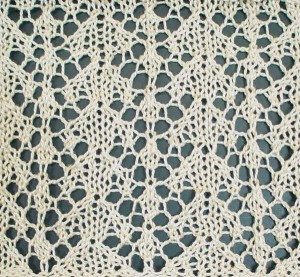
Learn how the symbol chart itself, the symbol key, and the visual similarity to the actual knitted piece all work together to communicate how to knit a lace pattern stitch.
Knitting symbol charts are comprised of two main components: the Chart Graph itself and the Symbol Key.
The Chart Graph is the symbolic instructions for the stitch pattern. The graph is a grid of rows and columns representing knitted rows (or rounds if knitting circularly) and stitches respectively. Each graph grid usually represents the result of making one stitch or stitch sequence. (“No stitch” is an exception that I will cover separately in an upcoming Bit-size Tutorial.)
The chart graph rows are arranged horizontally from bottom to top to simulate the building of one row (or round) above another as our knitting progresses.
The columns are arranged vertically so that reading progresses from right to left on RS rows (or rounds), and from left to right on WS rows.
(Note: WS rows are sometimes omitted if there is only plain knitting or purling involved; if this is the case, there should be a written statement somewhere in the pattern publication to let you know how to work the un-charted rows.)
The Symbol Key is an important component of instructions that you should expect to have been provided in any pattern publication that uses knitting charts. This is the language translation of each chart grid symbol into its corresponding knitting instruction.
Before jumping into the Chart Grid, take time to study the Symbol Key and acquaint yourself with its language translation. (Note: If the Symbol Key itself refers to abbreviations or special terms, look for the description of these in the publication.)
Depending on the choice of symbols used in the pattern instructions, Lace Charts often look similar to the stitch pattern they will produce when knitted as viewed from the right side (or preferred side if reversible/nearly reversible).

Visual similarity of knitted swatch to lace chart graph (the chart has been repeated 3 times across each row; the WS return rows were purled)
Did you notice some similarity in the chart for the Lace Cable Bookmark project this month? This similarity can help you in visually checking your knitting for reasonability as mentioned in the post on Striving for Perfect Results.
How are you doing with the Lace Cable Bookmark project this month? I hope I made everything easy to find in the pattern instructions. Have you been using the chart, or the written instructions, or both? Are you having fun? (I hope!)
I’ll be back with more about lace charts, tips, etc. in a few days. ‘Til then, feel free to share your progress, questions, comments, etc. I don’t want things to get too quiet and think I am the only one knitting and talking around here!


 HeartStrings FiberArts
 Knitting Bits of Lace on Facebook
 Ravelry Store